

Part 3: Aussies are more bullish than Brits
Litigation Superforecasting Survey
We issued a survey to solicitors, barristers, corporates and other users of legal advice around the world, asking them to put a percentage number against the following ten probabilistic phrases commonly used by lawyers:
- “near certainty”
- “significant likelihood”
- “serious possibility”
- “strong prospects”
- “good prospects”
- “reasonable prospects”
- “reasonably arguable”
- “more likely than not”
- “fair chance”
- “on balance”
The phrases were displayed in a random order each time respondents visited the online survey to reduce any biases that might be induced by the order in which the phrases were presented.
Balance recruited the assistance of cognitive neuroscientist Dr. Stephen Fleming of University College London, to help analyse the data.
Take the survey at www.balancelegalcapital.com.1
You run a multi-national company with significant operations in the UK and Australia. You chose those jurisdictions because both are English-speaking, share a legal system rooted in the common law, and enjoy a close cultural and historical connection.
A legal issue arises in both markets from the same set of facts.
You have the option to sue in London or in Australia.
Your English lawyer opines that you have “good prospects” of success under English law and in the High Court.
Your Australian lawyer also opines that you have “good prospects” in the Supreme Court of New South Wales.
Do the Australian lawyers and English lawyers mean the same thing?
A recent survey by Balance Legal Capital has obtained some striking data on the way people think about probabilistic phrases found in legal advice.
It turns out that respondents in Australia attach higher confidence to phrases like “good prospects” than respondents in the UK.
Chart 1: “Raincloud” plots showing scores from Australia and the UK2
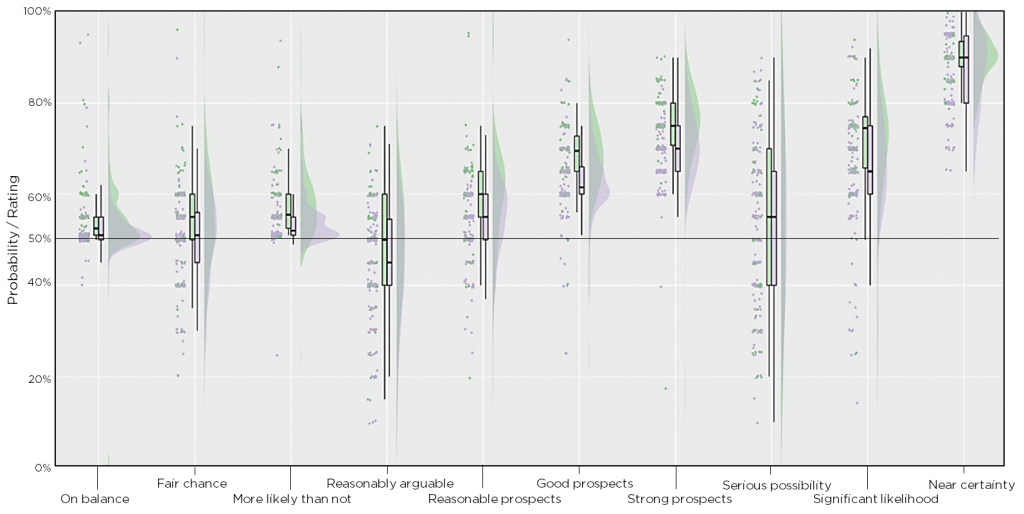
Australia v UK
We found that Australian solicitors gave all 10 of the verbal labels higher scores than UK solicitors, on average, 4 percentage points higher, leading to a statistically significant difference between the groups (see Chart 1 and Table 1).
“Australians gave all 10 of the verbal labels higher scores than UK solicitors”
Robert Rothkopf, Managing Partner of Balance Legal Capital commented:
“We invest in litigation in both the UK and Australia. We’ve often compared the law in each jurisdiction and wonder whether the increased confidence we see from our Australian partners in the data comes from the fact that certain causes of action are simply easier to run in Australia than they are in the UK.”
Simon Burnett, partner and head of Australia at Balance Legal Capital added:
“Causes of action such as “misleading or deceptive conduct” under the Australian Consumer Law and the class action regime are powerful legal tools for claimants in Australia. They do not have as effective counterparts in the UK. I would have thought that these factors (as well as the sunnier positive attitudes of Australians like me) could explain these differences.”
Table 1: Australia v UK - mean and variance scores
| Verbal label | Country | Mean | Median | SD2 | Lower | Upper |
| On balance | AUS | 53.7 | 53 | 9.1 | 44.7 | 62.8 |
| On balance | UK | 52.8 | 51 | 6.7 | 46.1 | 59.6 |
| Fair chance | AUS | 54.4 | 55 | 1.8 | 42.6 | 66.2 |
| Fair chance | UK | 50.7 | 51 | 9.7 | 41.0 | 60.3 |
| More likely than not | AUS | 58.4 | 56 | 7.3 | 51.0 | 65.7 |
| More likely than not | UK | 54.5 | 52 | 6.3 | 48.2 | 60.7 |
| Reasonably arguable | AUS | 48.8 | 50 | 2.1 | 36.6 | 60.9 |
| Reasonably arguable | UK | 44.4 | 45 | 2.4 | 32.0 | 56.8 |
| Reasonable prospects | AUS | 59.9 | 60 | 1.7 | 48.1 | 71.6 |
| Reasonable prospects | UK | 54.6 | 55 | 8.1 | 46.4 | 62.7 |
| Good prospects | AUS | 67.7 | 70 | 7.6 | 60.1 | 75.2 |
| Good prospects | UK | 63.0 | 62 | 8.7 | 54.3 | 71.7 |
| Strong prospects | AUS | 74.9 | 75 | 9.8 | 65.1 | 84.7 |
| Strong prospects | UK | 70.7 | 70 | 7.2 | 63.4 | 77.9 |
| Serious possibility | AUS | 54.2 | 55 | 9.8 | 34.4 | 74.0 |
| Serious possibility | UK | 53.6 | 55 | 6.8 | 36.8 | 70.5 |
| Significant likelihood | AUS | 71.5 | 75 | 1.0 | 60.4 | 82.5 |
| Significant likelihood | UK | 64.5 | 65 | 4.2 | 50.3 | 78.6 |
| Near certainty | AUS | 89.7 | 90 | 4.6 | 85.1 | 94.3 |
| Near certainty | UK | 86.8 | 90 | 8.0 | 78.8 | 94.8 |
“Powerful legal tools for claimants in Australia…do not have as effective counterparts in the UK”
Notes:
- Balance’s Litigation Superforecasting Survey was inspired by the research of Philip Tetlock (the author of Superforecasting) which, based on studies of behavioural economists and forecasting tournament data, endorses a number of techniques found to improve forecasting accuracy. One of these is the use of numbers rather than phrases when making probabilistic assessments.
- Raincloud plots are data visualizations which show raw data, probability density, and key summary statistics such as median, mean, and relevant confidence intervals while preserving the ‘inference at a glance’ nature of barplots. For more, see: Allen M, Poggiali D, Whitaker K, Marshall TR, Kievit R. (2018) Raincloud plots: a multi-platform tool for robust data visualization. PeerJ Preprints 6:e27137v1.
- SD = Standard Deviation
To download this article as a PDF, please click here.

Robert Rothkopf is Managing Partner of Balance Legal Capital, a litigation funder in London.
Prior to starting Balance, Robert was a litigator at Herbert Smith Freehills. Robert and his team apply behavioural economic principles to litigation finance investment decisions
Stephen Fleming PhD is director of the Metacognition Group at the Wellcome Centre for Human Neuroimaging.
Stephen’s research focuses on the mechanisms supporting conscious awareness, metacognition and decision-making in the adult human brain.


